Stock Market Analysis
Developed a comprehensive power bi dashboard for stock market analysis incorporating key financial indicators and historical stock performance.
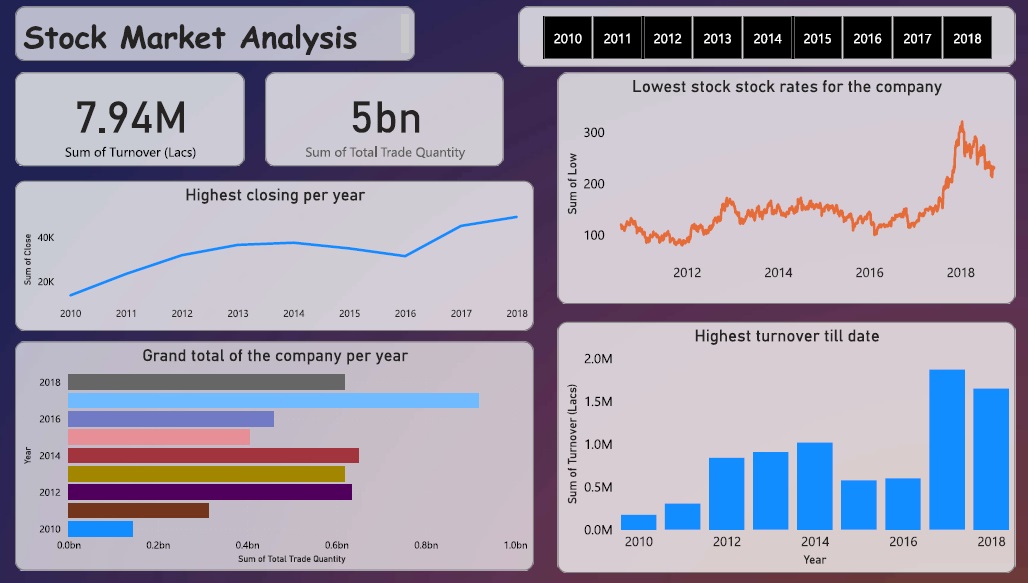
Key points that I highlighted:
- Highest closing as per year
- Grand total of the company per year
- Lowest stock rates for the company
- Highest turnover till date
Approach followed.
- Cleansed the data to remove duplicates, transform data into a suitable format for analysis
- Created compelling visualizations such as line charts for stock trends. Leverage Power BI's visualization options to convey information effectively.
- Implemented slicers, filters, and drill-down functionalities to make the dashboard interactive.
Tools used
- MS Excel
- Power BI
Download Power BI file
Click Here