Quarterly Sales Analysis
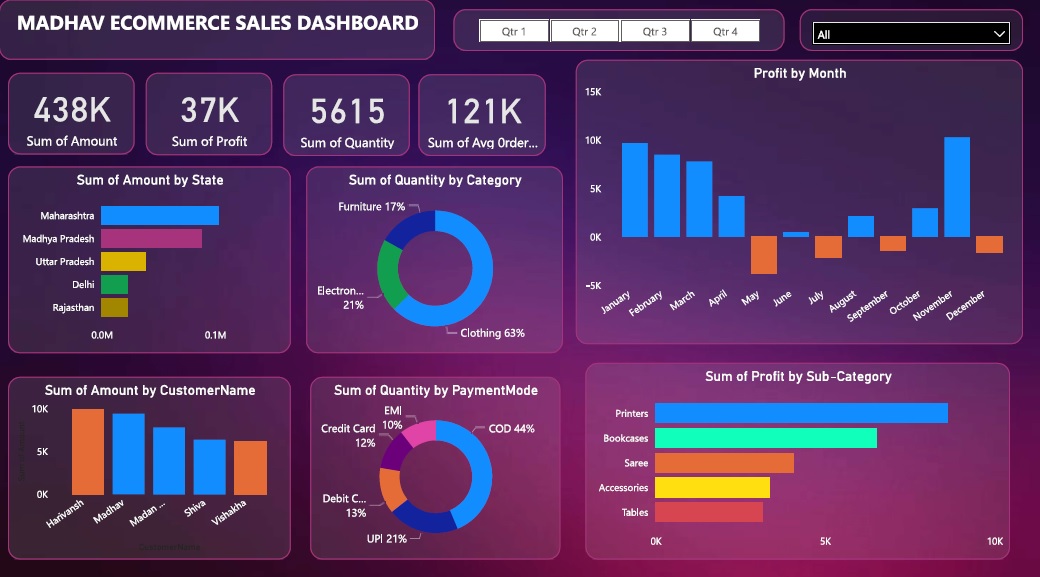
This was a guided project. In this I develop a dynamic and comprehensive eCommerce Sales Dashboard using Power BI to provide actionable insights.
The dashboard encompasses key metrics such as
- State wise revenue.
- Quantity based on the category as well as Payment mode
- Amount as per the customer
- Profit per month
- Profit based on sub category
The approach that I followed:
- Utilizeed data visualizations, including bar graphs, cards, pie chart to present information in a clear and intuitive manner.
- Implement filters and interactive elements to allow users to explore sales data based on time periods.
Download Power BI file
Click Here